- 38% of mortgaged owners spend roughly a third or more of household income on housing.
- Almost 60% of renters spend 30% or more of their household income on rent.
- Renters need to earn 2.6 times minimum wage to afford the average asking rent in Santa Cruz County (CHP 2021)
- About 60% of renters in South County spend more than a third of their income on rent compared to only about 50% of renters in Mid-County.
Focus On
Learn More
Housing
Explore the data to learn more about different regions of Santa Cruz County are more impacted by expensive housing.
County: Santa Cruz
(Compared to CA Counties)
Focus On
Learn More
Homelessness
Explore the data to learn more about homelessness in Santa Cruz County.
County: Santa Cruz
(Compared to Trend over Time)
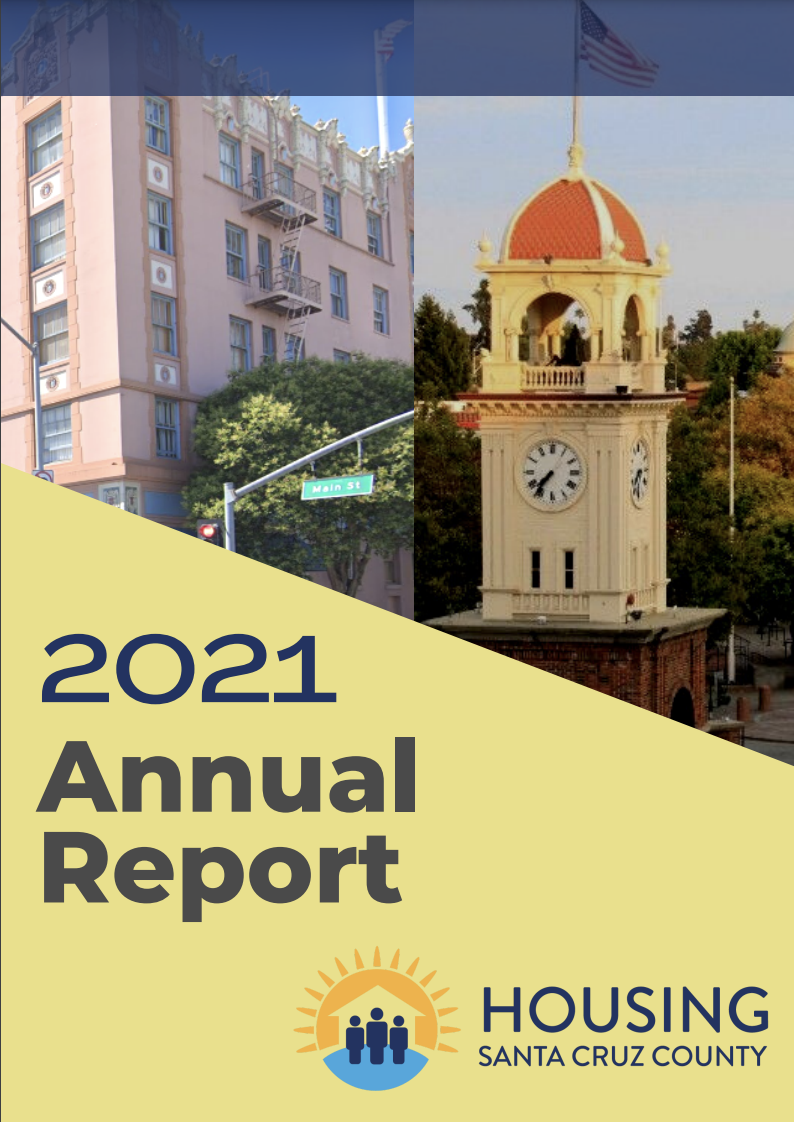
This report gives an overview of the status of housing in Santa Cruz County and the progress of initiatives to increase access to housing.
Learn More
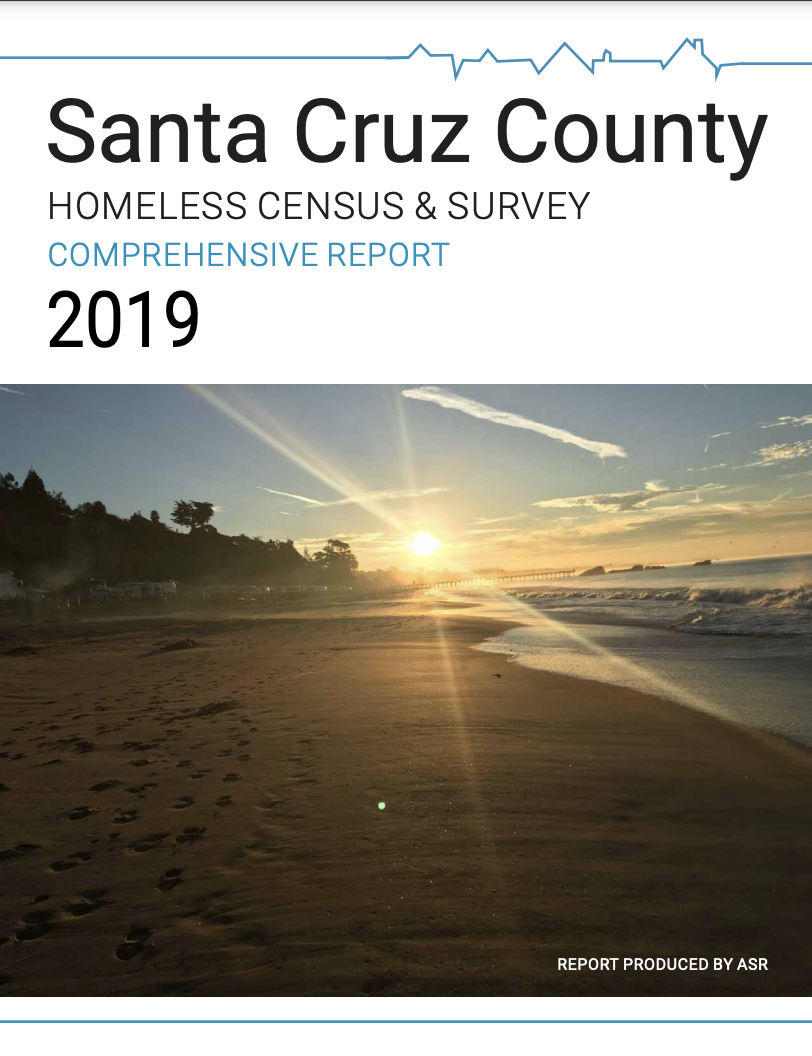
The Point-in-Time Count is currently the only source of nationwide data on both sheltered and unsheltered homelessness.
Learn More
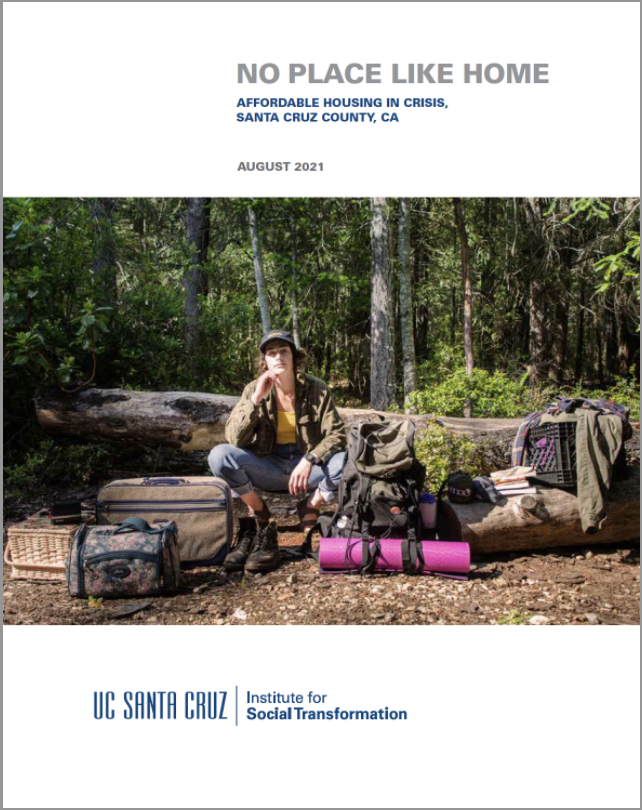
No Place Like Home is a community-initiated, student-engaged research project on the affordable housing crisis in Santa Cruz County.
Learn More
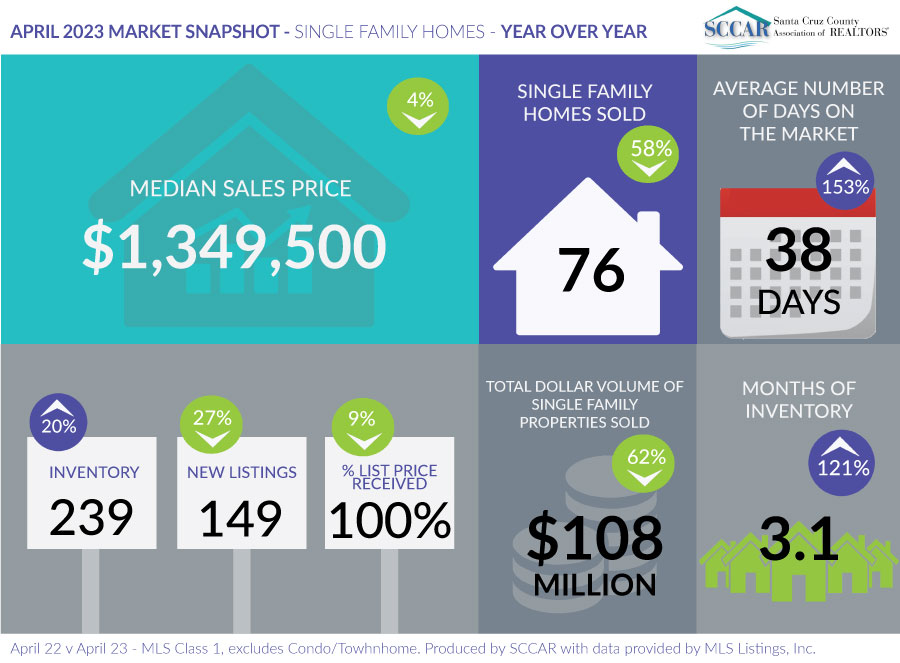
This annual housing market snapshot from the Santa Cruz County Association of Realtors shows housing market trends.
Learn More
This report, developed by the County Human Services Department, provides a strategic framework for addressing homelessness in Santa Cruz County.
Learn More
The community indicators on the CORE page provide an overview of how Santa Cruz County residents are doing in key areas of this community impact.
Learn More
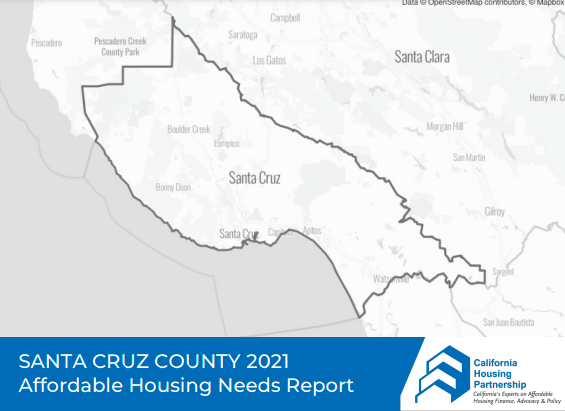
Affordable housing Needs Report for Santa Cruz County 2021 shares key findings and statewide policy recommendations. Produced by the California Housing Partnership.
Learn More
This impact and learning report proposes community solutions for ending homelessness.
Learn More
Learn more about housing costs and accessibility in different parts of Santa Cruz County by exploring the data below.
An overview of what the data shows:
- More seniors are living alone in North County, compared to Mid-County, South County, and the San Lorenzo Valley
- Homeowners in Mid-County and the San Lorenzo Valley have expenses higher than North-County, South-County, or the California state average
- Homeownership rates are lowest in South County
- Almost 60% of South County renters spend roughly a third or more of their income in rent


