Search for Indicators
Disabilities
According to the Centers for Disease Control and Prevention, more than 50 million people (approximately 20% of the population) in the United States have a disability, and, of those, more than 34 million (>12%) live with a severe disability. Poverty and underemployment are major problems facing individuals with disabilities.
Indicator Gauge Icon Legend
Legend Colors
Red is bad, green is good, blue is not statistically different/neutral.
Compared to Distribution
 the value is in the best half of communities.
 the value is in the 2nd worst quarter of communities.
 the value is in the worst quarter of communities.
Compared to Target
 meets target;
  does not meet target.
Compared to a Single Value
 lower than the comparison value;
 higher than the comparison value;
 not statistically different from comparison value.
Trend

 non-significant change over time;
 significant change over time;
  no change over time.
Compared to Prior Value
 higher than the previous measurement period;
 lower than the previous measurement period;
 no statistically different change from previous measurement period.
Health / Disabilities
Health / Disabilities
County: Santa Cruz
Value
Compared to:
County: Santa Cruz Persons with a Cognitive Difficulty
County: Santa Cruz Persons with a Cognitive Difficulty
5.4%
(2018-2022)
Compared to:


CA Value
(4.6%)
The regional value is compared to the California state value.
US Value
(5.3%)
The regional value is compared to the national value.
Trend
This comparison measures the indicator’s values over multiple time periods.<br>The Mann-Kendall Test for Statistical Significance is used to evaluate the trend<br>over 4 to 10 periods of measure, subject to data availability and comparability.
County: Santa Cruz Persons with a Disability
County: Santa Cruz Persons with a Disability
11.7%
(2018-2022)
Compared to:

CA Value
(11.0%)
The regional value is compared to the California state value.
US Value
(12.9%)
The regional value is compared to the national value.
Trend
This comparison measures the indicator’s values over multiple time periods.<br>The Mann-Kendall Test for Statistical Significance is used to evaluate the trend<br>over 4 to 10 periods of measure, subject to data availability and comparability.
County: Santa Cruz Persons with a Hearing Difficulty
County: Santa Cruz Persons with a Hearing Difficulty
3.3%
(2018-2022)
Compared to:
CA Value
(2.9%)
The regional value is compared to the California state value.
US Value
(3.6%)
The regional value is compared to the national value.
Trend
This comparison measures the indicator’s values over multiple time periods.<br>The Mann-Kendall Test for Statistical Significance is used to evaluate the trend<br>over 4 to 10 periods of measure, subject to data availability and comparability.
County: Santa Cruz Persons with a Self-Care Difficulty
County: Santa Cruz Persons with a Self-Care Difficulty
2.3%
(2018-2022)
Compared to:

CA Value
(2.7%)
The regional value is compared to the California state value.
US Value
(2.6%)
The regional value is compared to the national value.
Trend
This comparison measures the indicator’s values over multiple time periods.<br>The Mann-Kendall Test for Statistical Significance is used to evaluate the trend<br>over 4 to 10 periods of measure, subject to data availability and comparability.
County: Santa Cruz Persons with a Vision Difficulty
County: Santa Cruz Persons with a Vision Difficulty
2.1%
(2018-2022)
Compared to:
CA Value
(2.1%)
The regional value is compared to the California state value.
US Value
(2.4%)
The regional value is compared to the national value.
Trend
This comparison measures the indicator’s values over multiple time periods.<br>The Mann-Kendall Test for Statistical Significance is used to evaluate the trend<br>over 4 to 10 periods of measure, subject to data availability and comparability.
County: Santa Cruz Persons with an Ambulatory Difficulty
County: Santa Cruz Persons with an Ambulatory Difficulty
4.9%
(2018-2022)
Compared to:
CA Value
(5.8%)
The regional value is compared to the California state value.
US Value
(6.7%)
The regional value is compared to the national value.
Trend
This comparison measures the indicator’s values over multiple time periods.<br>The Mann-Kendall Test for Statistical Significance is used to evaluate the trend<br>over 4 to 10 periods of measure, subject to data availability and comparability.
County: Santa Cruz Adults with Disability Living in Poverty
County: Santa Cruz Adults with Disability Living in Poverty
22.2%
(2018-2022)
Compared to:
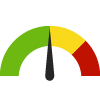

CA Counties
The distribution is based on data from 58 California counties.
U.S. Counties
The distribution is based on data from 3,132 U.S. counties and county equivalents.
CA Value
(22.7%)
The regional value is compared to the California state value.
US Value
(24.9%)
The regional value is compared to the national value.
Trend
This comparison measures the indicator’s values over multiple time periods.<br>The Mann-Kendall Test for Statistical Significance is used to evaluate the trend<br>over 4 to 10 periods of measure, subject to data availability and comparability.
County: Santa Cruz Children with a Disability
County: Santa Cruz Children with a Disability
5.3%
(2018-2022)
Compared to:
CA Value
(3.7%)
The regional value is compared to the California state value.
US Value
(4.5%)
The regional value is compared to the national value.
Trend
This comparison measures the indicator’s values over multiple time periods.<br>The Mann-Kendall Test for Statistical Significance is used to evaluate the trend<br>over 4 to 10 periods of measure, subject to data availability and comparability.
Health / Older Adults
Health / Older Adults
County: Santa Cruz
Value
Compared to:
County: Santa Cruz Adults 65+ with a Vision Difficulty
County: Santa Cruz Adults 65+ with a Vision Difficulty
5.4%
(2018-2022)
Compared to:

CA Value
(6.1%)
The regional value is compared to the California state value.
US Value
(6.0%)
The regional value is compared to the national value.
Trend
This comparison measures the indicator’s values over multiple time periods.<br>The Mann-Kendall Test for Statistical Significance is used to evaluate the trend<br>over 4 to 10 periods of measure, subject to data availability and comparability.
County: Santa Cruz Adults 65+ with an Independent Living Difficulty
County: Santa Cruz Adults 65+ with an Independent Living Difficulty
12.3%
(2018-2022)
Compared to:
CA Value
(16.4%)
The regional value is compared to the California state value.
US Value
(13.6%)
The regional value is compared to the national value.
Trend
This comparison measures the indicator’s values over multiple time periods.<br>The Mann-Kendall Test for Statistical Significance is used to evaluate the trend<br>over 4 to 10 periods of measure, subject to data availability and comparability.
County: Santa Cruz Adults 65+ with a Hearing Difficulty
County: Santa Cruz Adults 65+ with a Hearing Difficulty
12.4%
(2018-2022)
Compared to:

CA Value
(12.9%)
The regional value is compared to the California state value.
US Value
(13.7%)
The regional value is compared to the national value.
Trend
This comparison measures the indicator’s values over multiple time periods.<br>The Mann-Kendall Test for Statistical Significance is used to evaluate the trend<br>over 4 to 10 periods of measure, subject to data availability and comparability.
County: Santa Cruz Adults 65+ with a Self-Care Difficulty
County: Santa Cruz Adults 65+ with a Self-Care Difficulty
6.2%
(2018-2022)
Compared to:
CA Value
(9.5%)
The regional value is compared to the California state value.
US Value
(7.4%)
The regional value is compared to the national value.
Trend
This comparison measures the indicator’s values over multiple time periods.<br>The Mann-Kendall Test for Statistical Significance is used to evaluate the trend<br>over 4 to 10 periods of measure, subject to data availability and comparability.
County: Santa Cruz Adults 65+ with a Disability
County: Santa Cruz Adults 65+ with a Disability
28.8%
(2018-2022)
Compared to:
CA Value
(33.5%)
The regional value is compared to the California state value.
US Value
(33.3%)
The regional value is compared to the national value.
Trend
This comparison measures the indicator’s values over multiple time periods.<br>The Mann-Kendall Test for Statistical Significance is used to evaluate the trend<br>over 4 to 10 periods of measure, subject to data availability and comparability.
